Endpoint management reporting, solved
Device inventory, discovered apps, compliance, app deployment, security posture, and Windows Update reporting across Intune, Defender, and SCCM. Delivered in Power BI dashboards that never leave your tenant.
The reporting gap in Microsoft endpoint management
Microsoft gives you capable tools for managing endpoints: Intune for device management, Defender for security, SCCM for on-premises infrastructure. But each tool reports in isolation.
Intune's built-in reports are limited to paginated lists with basic filters. Defender has its own portal with separate dashboards. SCCM relies on SSRS reports that don't integrate with anything else. There's no native way to get a unified view of your endpoint estate across all three platforms.
For organizations managing thousands of devices across Windows, macOS, iOS, and Android, with co-managed environments spanning Intune and SCCM, this fragmentation means IT leadership gets incomplete pictures, help desk teams waste time cross-referencing portals, and security teams can't correlate threats with device posture.
What endpoint management reporting should look like
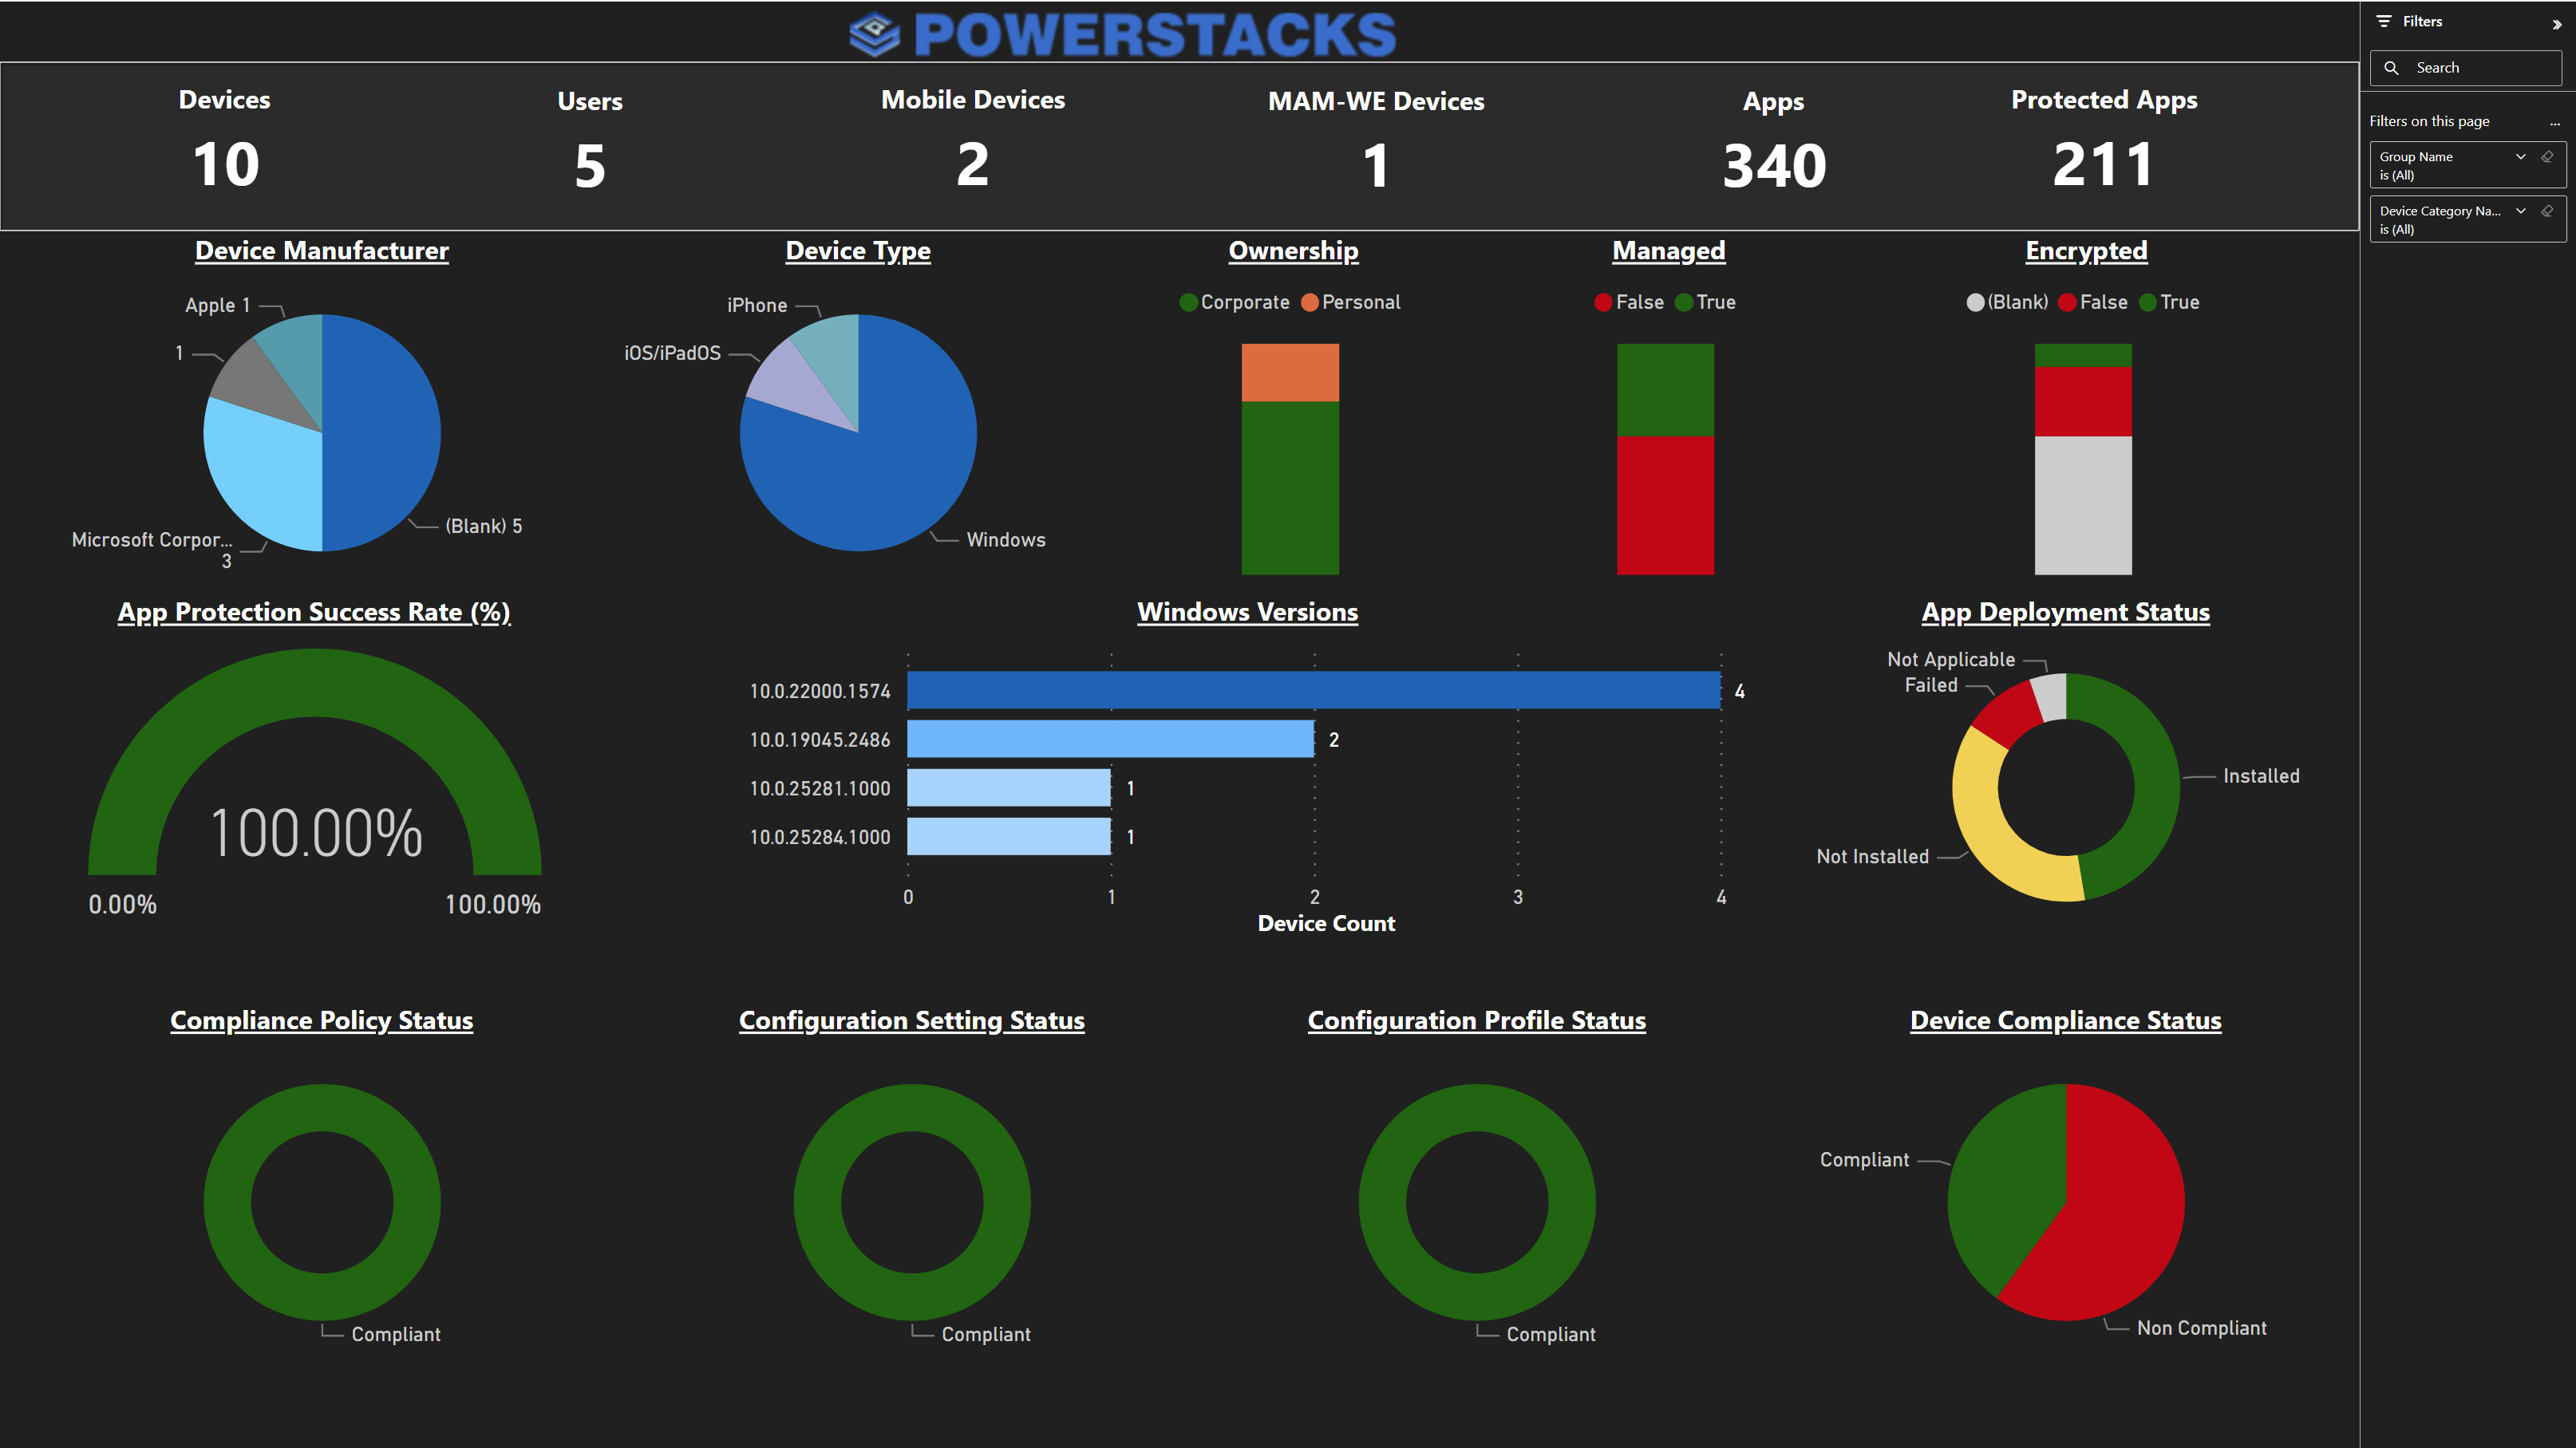
Summary Dashboard
Total device and user counts, platform distribution, compliance status, encryption coverage, Windows version breakdown, and app deployment health, all cross-filterable.
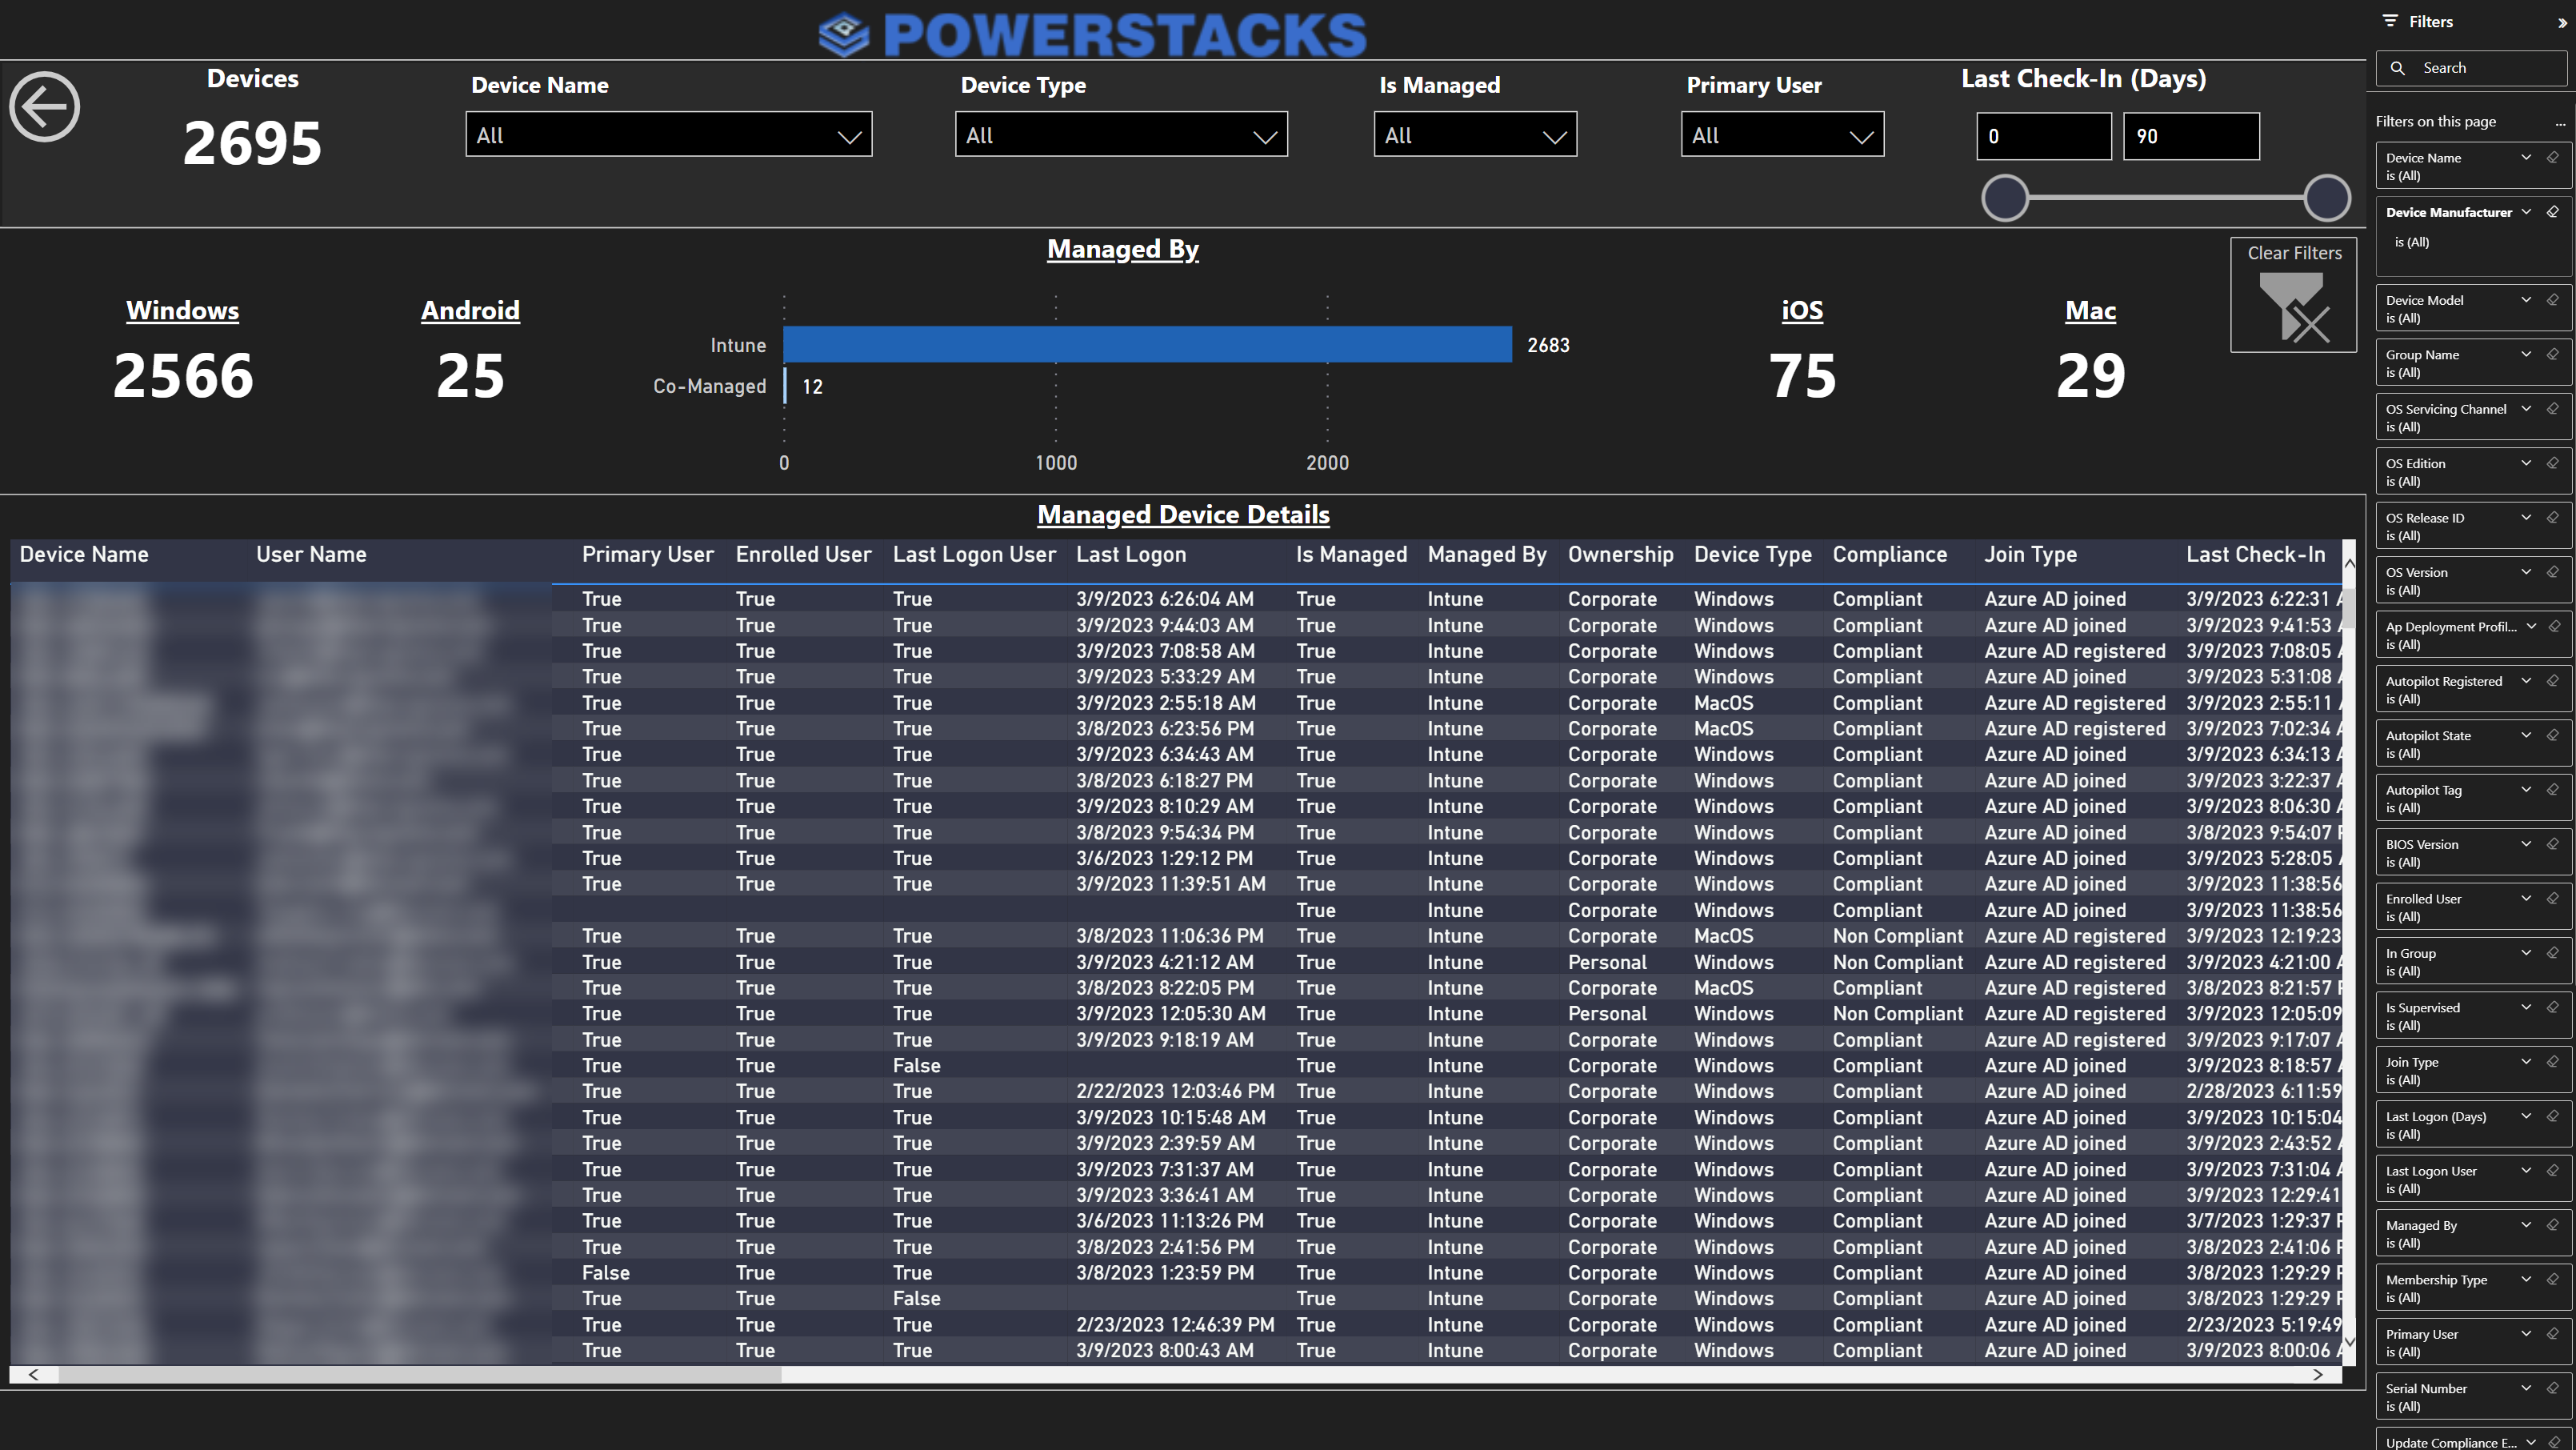
Device Inventory
Every managed device with primary user, last logon, compliance, ownership, join type, and last check-in. Filter by any column. Drill through to individual devices.
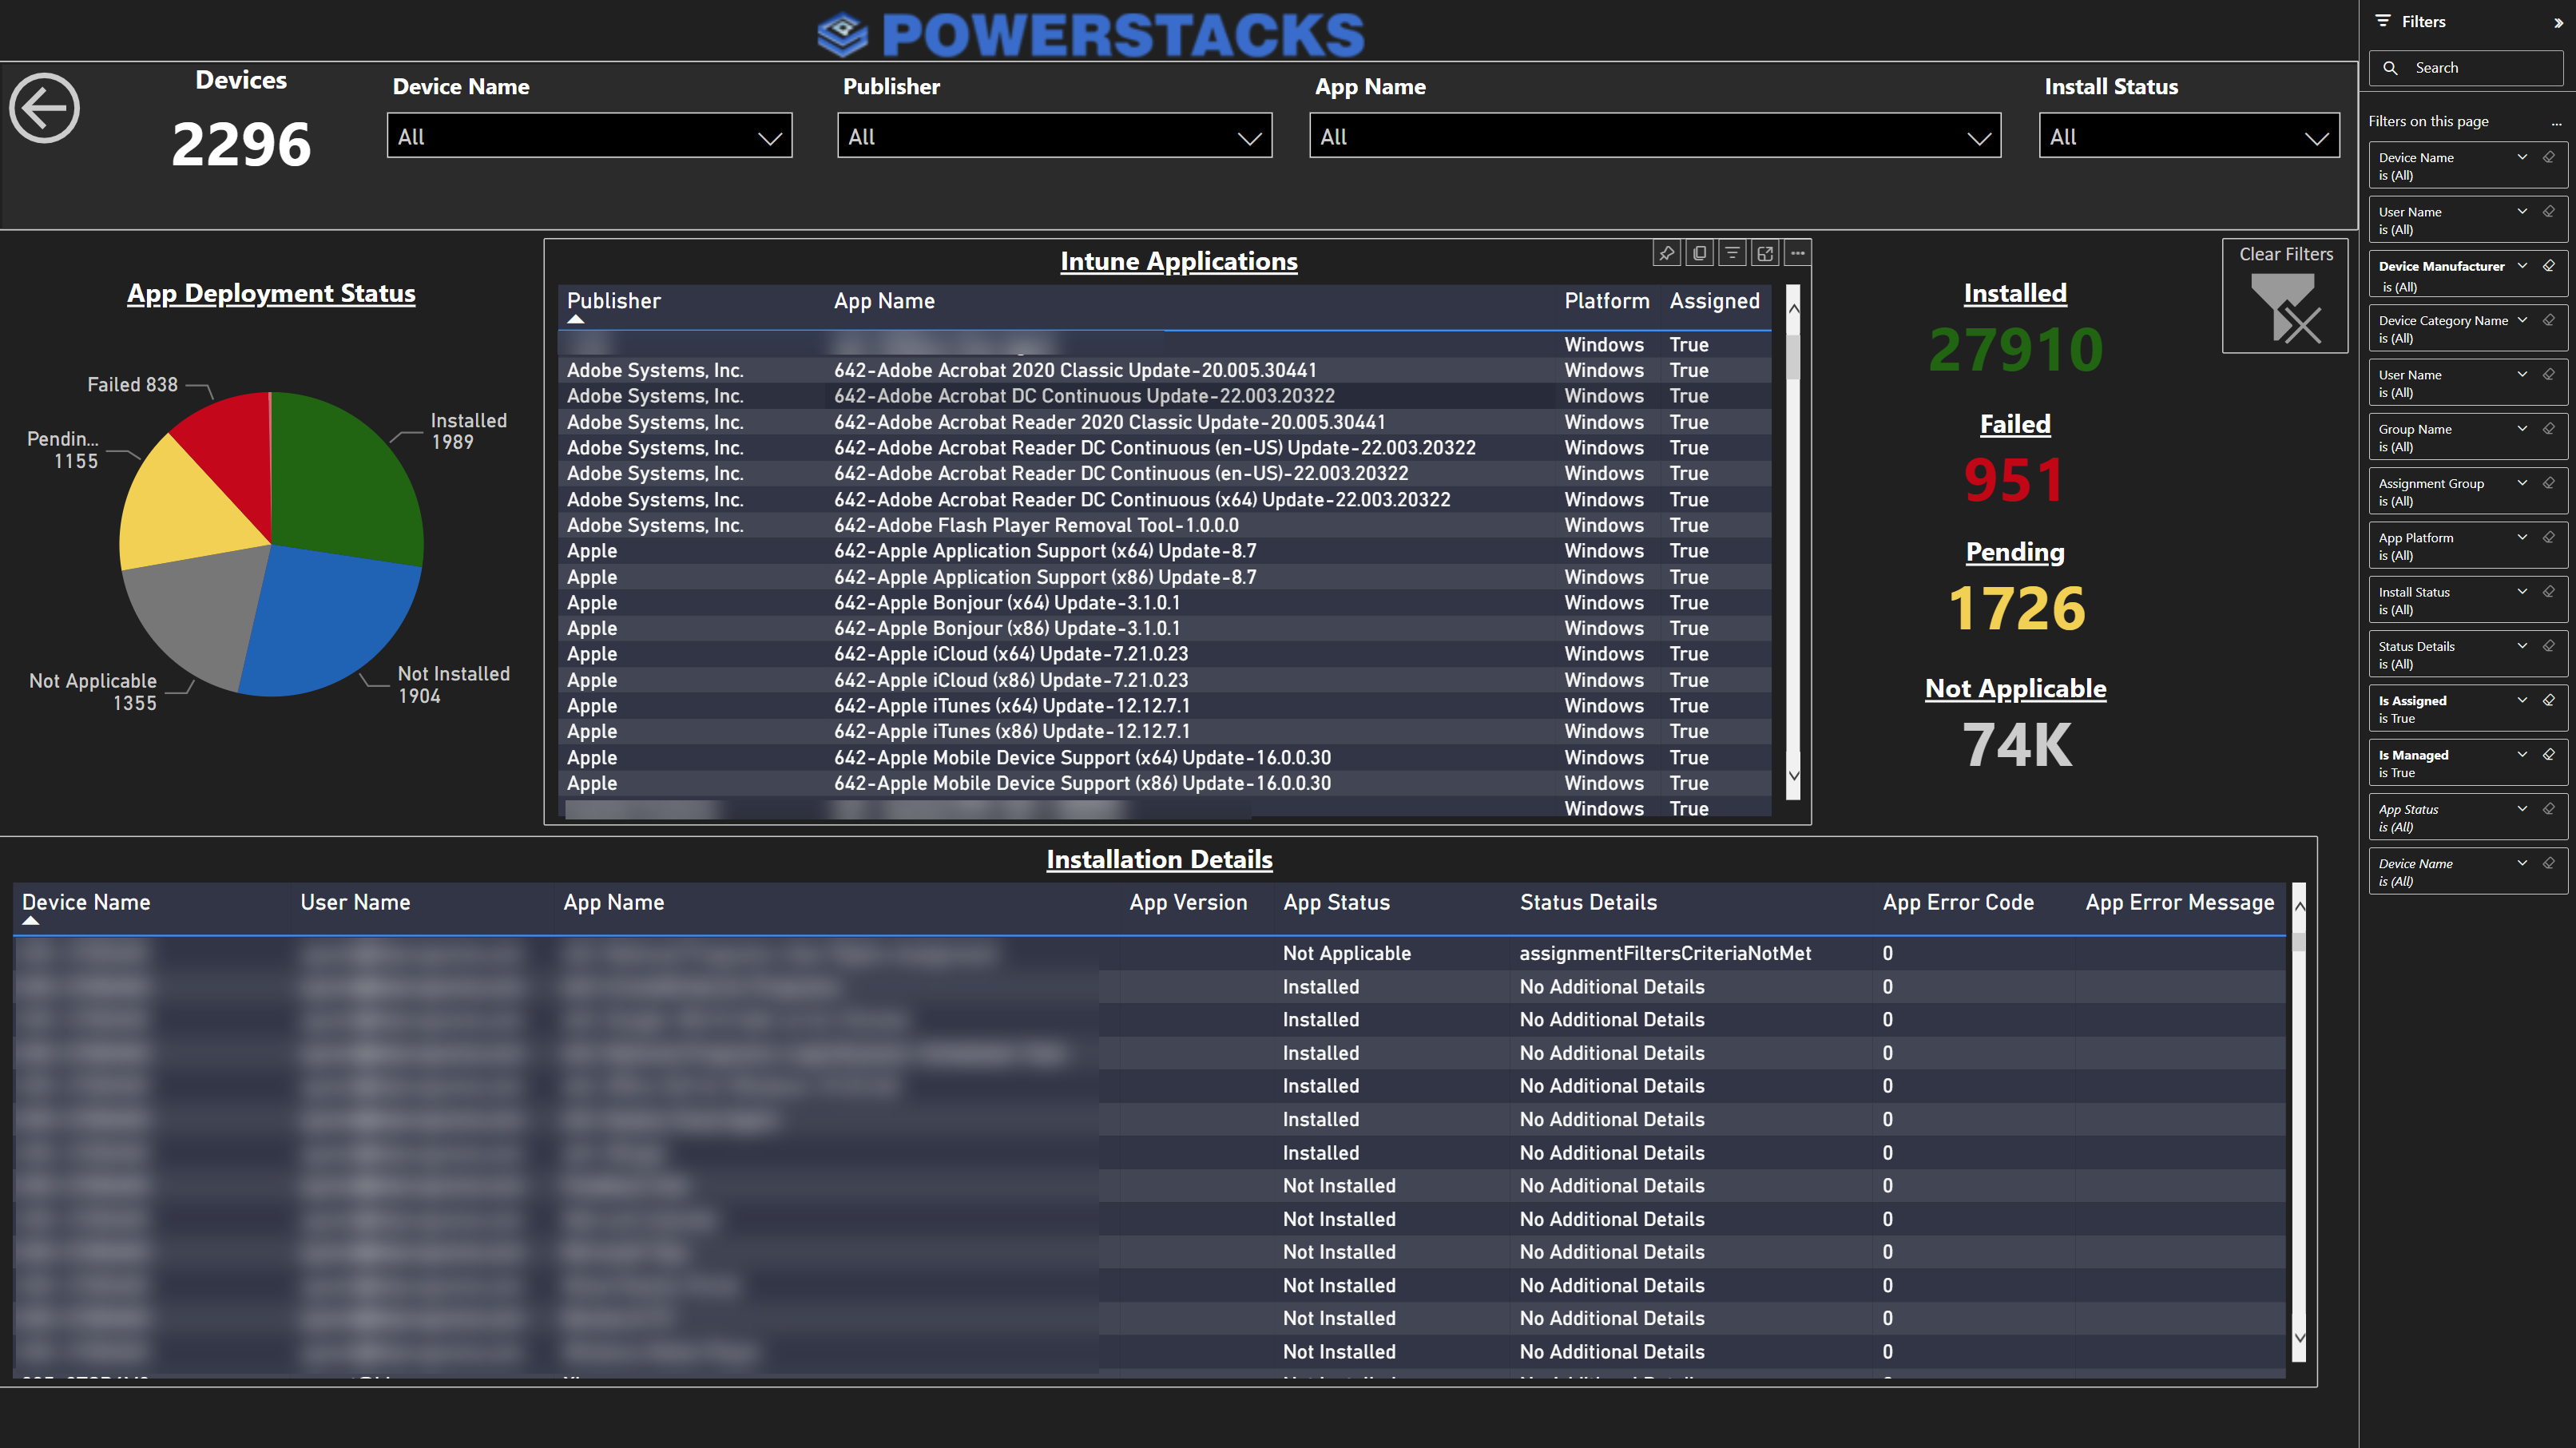
App Deployment & Discovered Apps
Unified view of deployed and discovered applications. Install status breakdown, per-device error codes, and publisher-level filtering across your entire app estate.
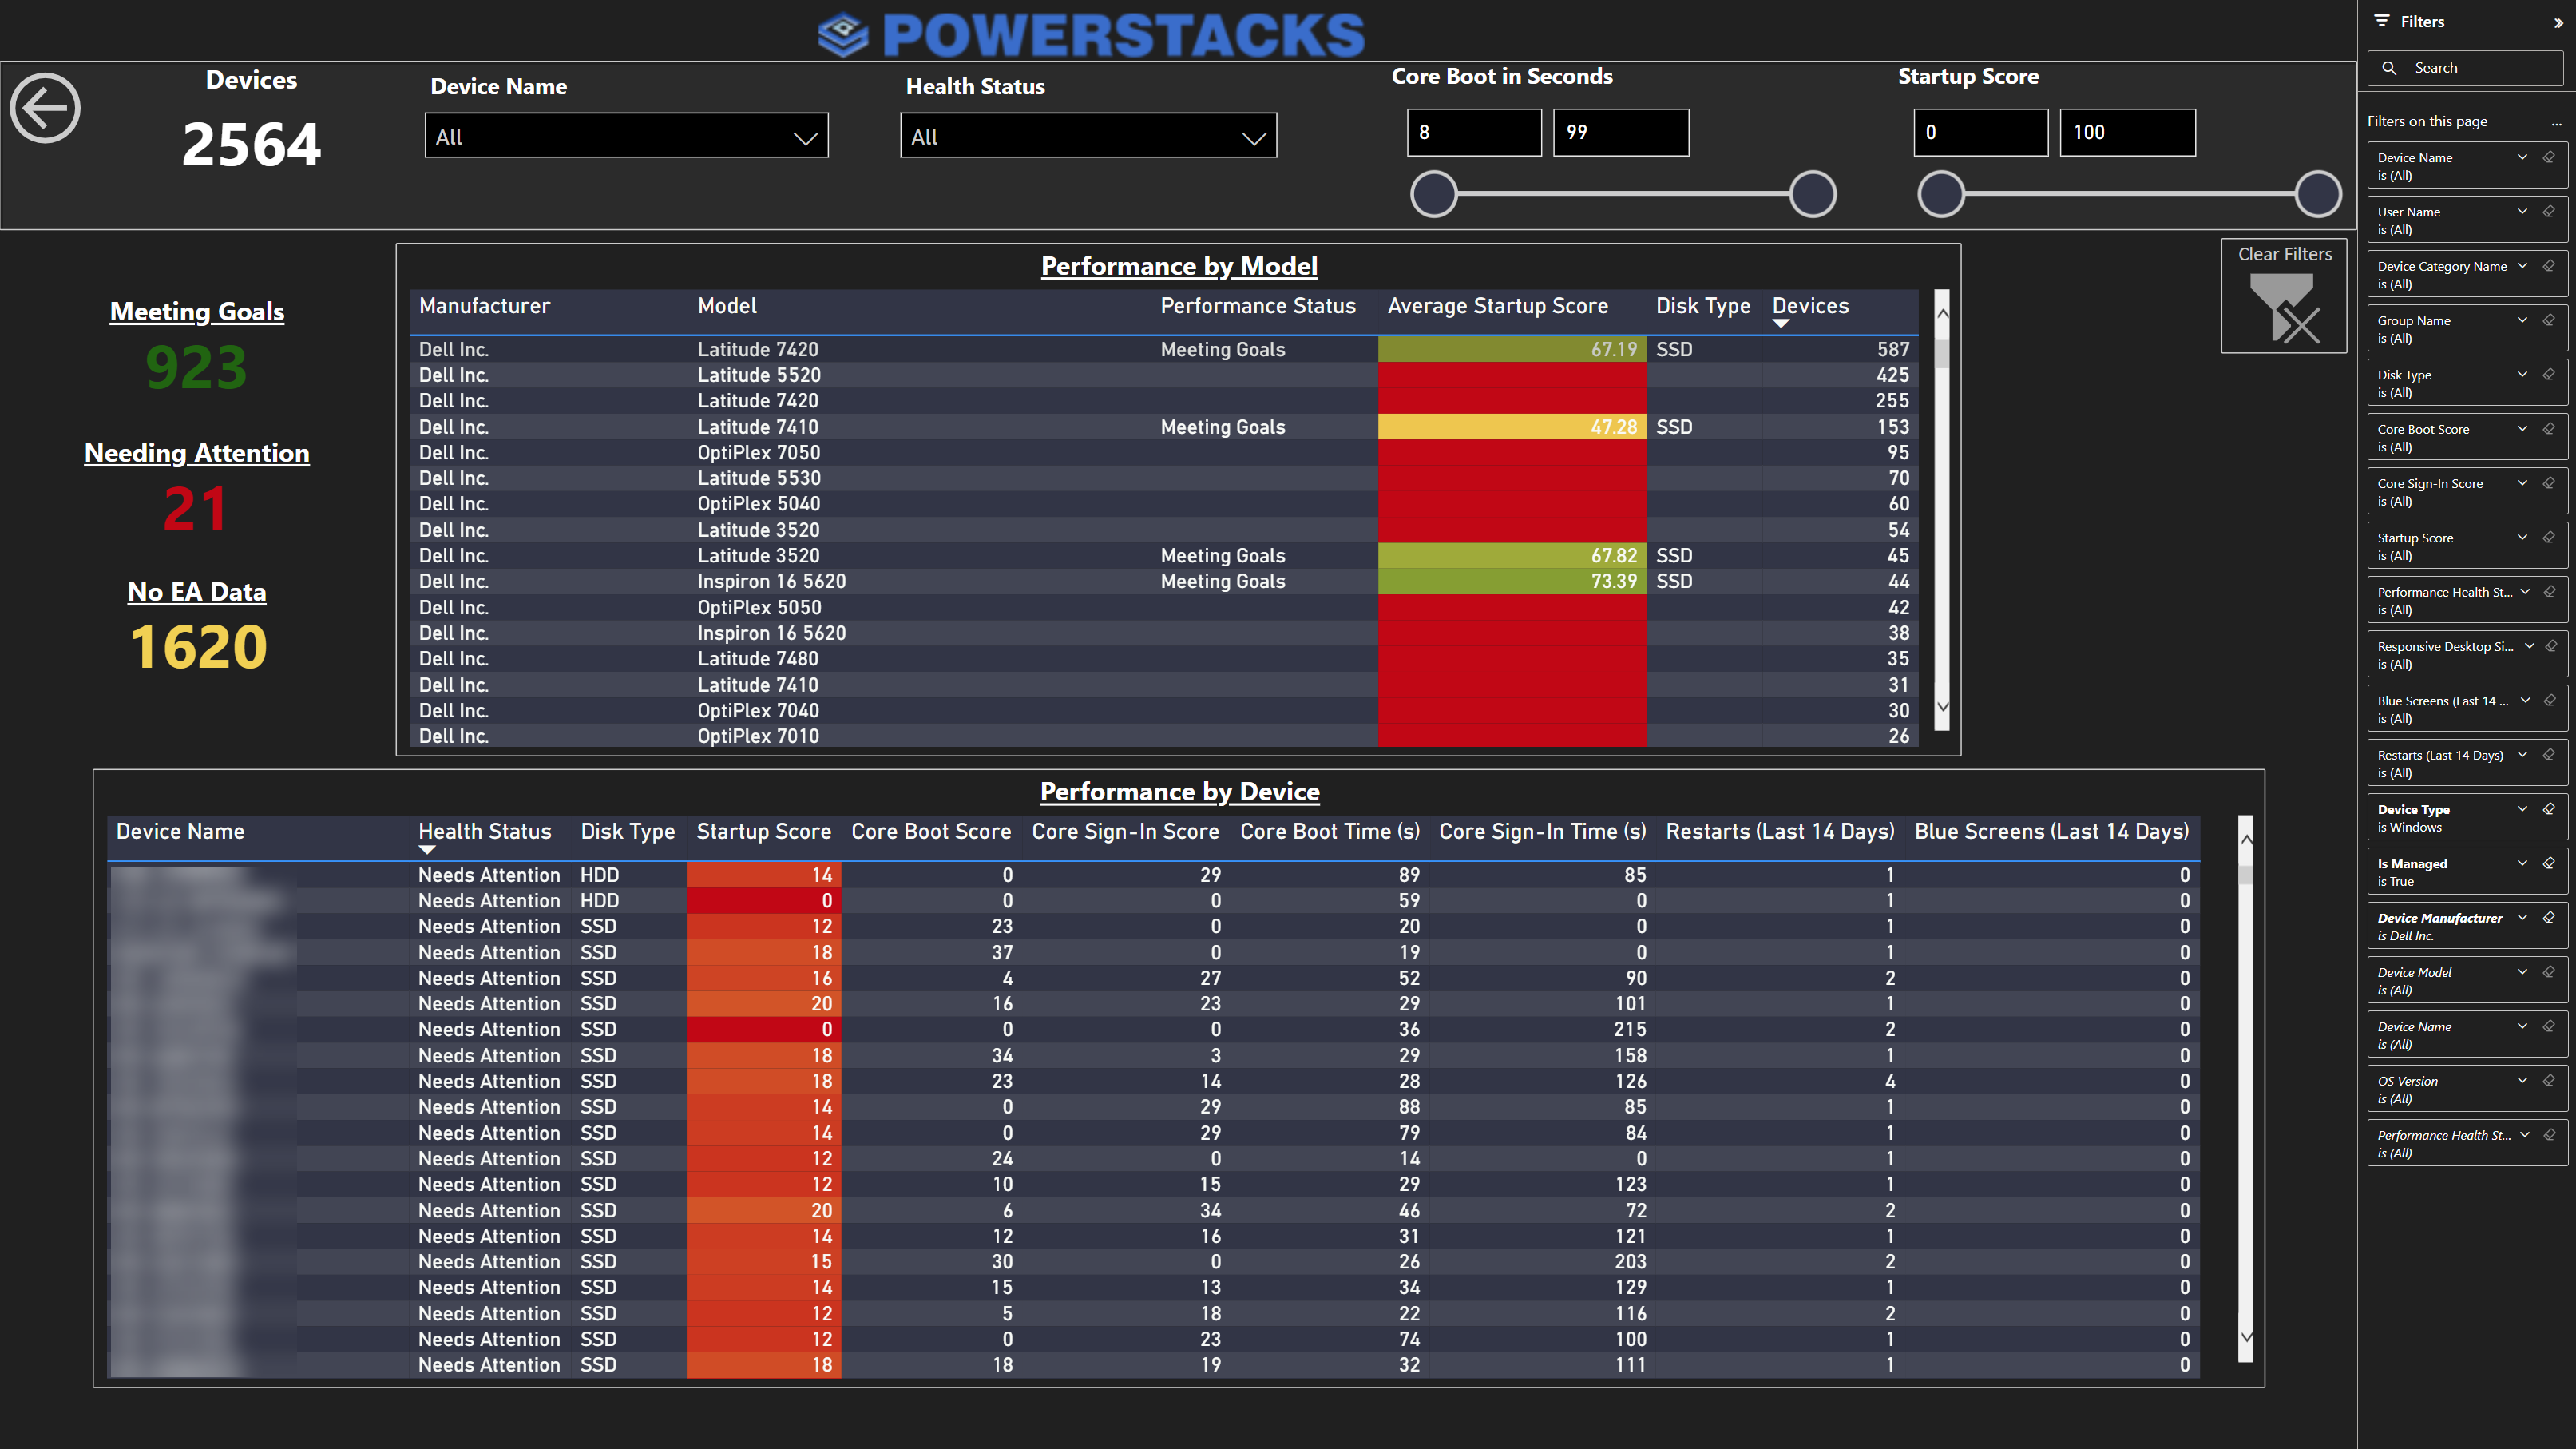
Startup Performance
Device boot times, logon durations, and performance trends. Identify slow devices before users report problems.
Every endpoint reporting challenge, addressed
Each area below represents a common reporting gap in the Microsoft endpoint management ecosystem. Here's what's missing natively and how PowerStacks fills it.
Device Inventory
The gap
The Intune admin center gives you a paginated device list with basic filters. No cross-filtering by manufacturer, OS version, compliance, and encryption simultaneously. No summary KPIs. Exporting more than 5,000 rows requires Graph API scripting with pagination handling.
How PowerStacks solves it
BI for Intune provides a complete device inventory dashboard with platform breakdowns, compliance correlation, and cross-filterable detail tables. Filter by any combination of device properties with a click.
Discovered Apps
The gap
Intune's discovered apps view is a flat list of application names and device counts. No filtering by platform, compliance status, or ownership. No connection to deployment data. No version distribution analysis or shadow IT identification.
How PowerStacks solves it
BI for Intune unifies discovered apps with deployment status, showing installed/failed/pending per app with device-level drill-through, error codes, and cross-filtering against your full device inventory.
Compliance Reporting
The gap
Native compliance reports show pass/fail per policy, but there's no way to see compliance trends over time, correlate non-compliance with device properties, or drill from a policy violation to the specific setting and device.
How PowerStacks solves it
BI for Intune tracks compliance over time with daily snapshots and provides policy-level and setting-level drill-through. See compliance trends by OS version, manufacturer, or department.
App Deployment Status
The gap
Intune shows per-app install status, but correlating failures across apps, identifying device-level patterns, and tracking deployment success rates over time requires manual CSV exports and spreadsheet work.
How PowerStacks solves it
BI for Intune aggregates deployment status across every app in your tenant with error code grouping, failure pattern analysis, and cross-filtering against device inventory for root cause identification.
Windows Update Compliance
The gap
Windows Update for Business reports require Log Analytics workspace setup and KQL queries. The data model is not intuitive, and there's no pre-built way to visualize update ring progress, installation timelines, or failure rates by build.
How PowerStacks solves it
BI for Intune includes Windows Update dashboards that show current update distribution, installation progression, and ring-level compliance, all in Power BI with no KQL required.
Security Posture (Defender)
The gap
Microsoft Defender for Endpoint has its own portal with vulnerability scores, threat detections, and security recommendations. But security data is siloed from Intune device inventory and compliance data, and there's no native cross-platform view.
How PowerStacks solves it
BI for Defender delivers threat detection, vulnerability management, and security posture dashboards in Power BI. Combined with BI for Intune, you get a unified view because both products share a common device key.
SCCM/ConfigMgr Reporting
The gap
SCCM's built-in reports rely on SQL Server Reporting Services (SSRS), which is capable but dated. Reports don't travel well outside the SCCM admin circle, and there's no way to merge SCCM data with Intune data for co-managed environments.
How PowerStacks solves it
BI for SCCM connects to your ConfigMgr SQL database via Power BI Gateway and shares the same device key as BI for Intune, which enables true co-management reporting in a single Power BI workspace.
Cross-Platform Unified View
The gap
The biggest gap in Microsoft endpoint management reporting: there is no native way to see a single device across Intune, Defender, and SCCM. Each tool has its own portal, its own data model, and its own reporting. Co-managed devices exist in multiple systems with no join key.
How PowerStacks solves it
BI for Intune, BI for Defender, and BI for SCCM all share a common unique device key. Merge all three datasets in a single Power BI report for a true single-pane-of-glass view of your endpoint estate.
Your reporting data stays in your tenant
Every PowerStacks reporting product delivers dashboards in your Power BI workspace using native Microsoft APIs. There are no agents on endpoints, no vendor-hosted portals, and no data leaving your compliance boundary.
Your security data, device inventory, compliance records, and application information are governed by your Microsoft 365 tenant policies: sensitivity labels, audit logging, and conditional access. The same governance you apply to every other Power BI report applies here.
0
Agents to install on endpoints
0
Bytes of data sent to vendor infrastructure
100%
Data stays in your Microsoft tenant
Why a star schema matters for endpoint reporting
Most DIY approaches to Intune reporting dump raw Graph API responses into flat Power BI tables. This works for simple lists, but it breaks down when you need to correlate data across dimensions (devices with compliance with apps with users).
PowerStacks products use a star schema data model, the same dimensional modeling approach used in enterprise data warehouses. Fact tables (device check-ins, app installations, compliance evaluations) connect to dimension tables (devices, users, apps, policies) through proper relationships.
This means:
- ✓ Fast aggregation across millions of data points. Power BI's VertiPaq engine is optimized for star schemas
- ✓ Cross-filtering works naturally. Click a device manufacturer and every visual on the page updates
- ✓ Custom reports are drag-and-drop. Add any dimension to any visualization without writing DAX or M queries
- ✓ Cross-product joins. BI for Intune, BI for Defender, and BI for SCCM share a common device key, which enables single-pane-of-glass reporting
PowerStacks reporting products

BI for Intune
Device inventory, compliance, app deployment, discovered apps, Windows Updates, startup performance, and more. 200+ pre-built KPIs.
Learn More
BI for Defender
Threat detection, vulnerability management, security posture, application control, and CVE tracking. Security analytics in Power BI.
Learn More
BI for SCCM
Software updates, application deployment, device health, inventory, and co-management reporting. Connects via Power BI Gateway.
Learn MoreRelated guides
Intune Reporting Tools Compared (2026)
Full comparison of native Intune reporting, Graph API, Log Analytics, and third-party tools.
Single Pane of Glass Reporting
Merge Intune, Defender, and SCCM data in a single Power BI workspace.
Windows Update Reports Reimagined
A better way to visualize Windows Update for Business compliance and progression.
Self-Service Windows 11 Upgrades
Use Intune and BI for Intune to enable users to kick off their Windows 11 upgrade on their own schedule.
Start reporting on your endpoint estate
Try any PowerStacks reporting product with a free trial. Connect to your Intune, Defender, or SCCM environment in under an hour.